In financial markets, a pivot point is a price level that is used by traders as a possible indicator of market movement. A pivot point is calculated as an average of significant prices (high, low, close) from the performance of a market in the prior trading period. If the market in the following period trades above the pivot point it is usually evaluated as a bullish sentiment, whereas trading below the pivot point is seen as bearish.
It is common to derive additional levels of support and resistance, below and above the pivot point, respectively, by subtracting or adding price differentials calculated from previous trading ranges of the market.
A pivot point and the associated support and resistance levels are often turning points for the direction of price movement in a market. In an up-trending market, the pivot point and the resistance levels may represent a ceiling level in price above which the uptrend is no longer sustainable and a reversal may occur. In a declining market, a pivot point and the support levels may represent a low price level of stability or a resistance to further decline.
Pivots are especially popular in the FX market since many currency pairs do tend to fluctuate between these levels. Range-bound traders will enter a buy order near identified levels of support and a sell order when the asset nears the upper resistance. Pivot points also enable trend and breakout traders to spot key levels that need to be broken for a move to qualify as a breakout.
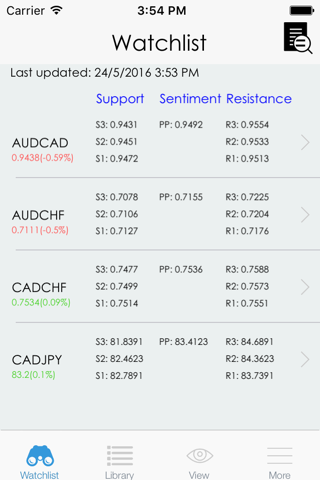
Easy Pivot Point automatically calculate and present the pivot point with resistance and support levels for each major currency pair on an easy to read dashboard.
Please note that pivot points are short-term trend indicators which is only useful for the current day trading.
Key features
- Timely display of pivot points with 3 levels of support and resistance for various instruments which includes currency pairs, commodities, indices and exotic pairs,
- Multi-timeframe analysis (H1, H4, Daily, Weekly and Monthly),
- Allows you to easily pin your favourite instrument to the top for each timeframe,
- Alert system that notifies you whenever price breaks the resistance or support level for each timeframe (only for subscribers)
If you choose to subscribe to our Premium plan, payment will be charged to your iTunes account, and your account will be charged for renewal 24 hours prior to the end of the current period. Auto-renewal may be turned off at any time by going to your settings in the iTunes Store after purchase. No cancellation of the current subscription is allowed during active subscription period.
Current price of subscription for the premium tier is $3.99 USD every month or unlimited tier for $7.99 USD and may vary from country to country.
Privacy Policy: http://easyindicators.com/privacy.html
Terms of Use: http://easyindicators.com/terms.html
All feedback and suggestions are welcome. You can reach us via email ([email protected]) or the contact feature within the app.
Join our facebook fan page.
http://www.facebook.com/easyindicators
Follow us on Twitter (@EasyIndicators)


